Choosing the 2026 best Fused Silica Quartz Wafer suppliers requires more than comparing purity percentages. Semiconductor, photonics, and laboratory users need stable geometry, low surface defects, and dependable batch-to-batch control. A wafer may look flawless under normal lighting, yet microscopic haze can appear after cleaning or thermal cycling. That detail can change process results.
Dr. James E. Shelby, a respected glass-science author, offers a useful principle: “A glass remembers its thermal history.” This observation matters when evaluating fused silica production. Suppliers should demonstrate controlled melting, annealing, machining, polishing, and packaging procedures. They should also provide traceable inspection data, including thickness tolerance, flatness, surface roughness, metallic contamination, and bubble or inclusion levels. Certifications help, but they do not replace technical conversations.
This guide examines suppliers through practical evidence rather than promotional claims. It considers material consistency, customization capability, delivery performance, technical support, and experience with demanding wafer applications. Strong suppliers should explain how they manage edge chipping, warpage, particles, and thermal stress. They should also clarify whether specifications apply to every lot or only selected samples.
No ranking is perfect. Some suppliers publish extensive data, while others protect process details. That difference can make direct comparisons difficult. Buyers should request recent certificates, sample wafers, inspection methods, and references from similar applications. A lower price may appear attractive, but unstable flatness can increase rework and interrupt production.
The following overview presents leading candidates for 2026. It is designed to support careful evaluation, not replace independent qualification. Reliability begins with evidence.
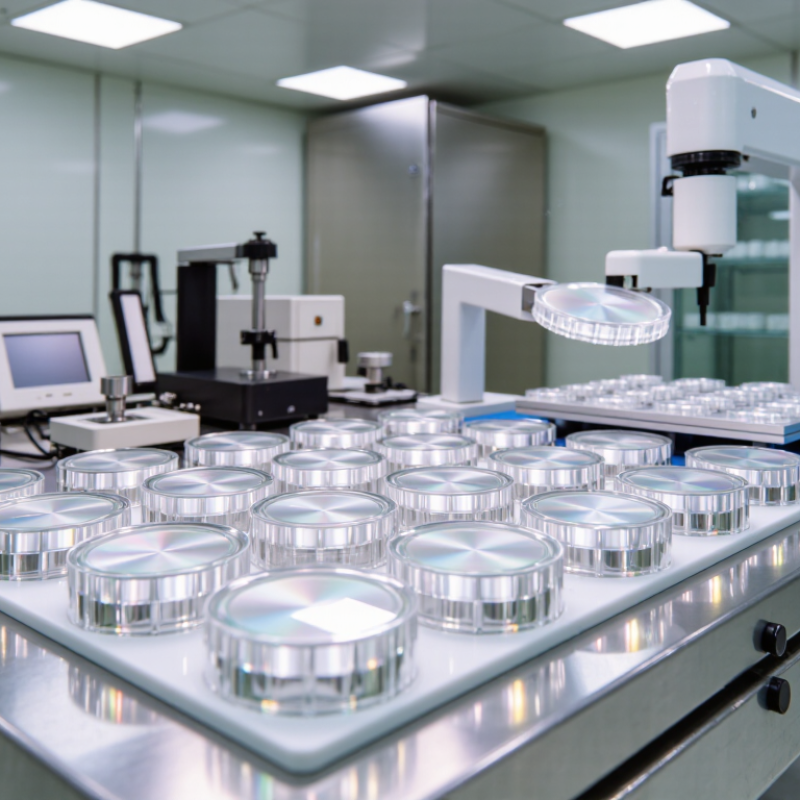
Fused Silica Wafer Basics: 99.99%+ SiO₂ and a 1,713°C Softening Point
2026 Best Fused Silica Quartz Wafer Suppliers?
Fused silica wafers are made from high-purity amorphous silicon dioxide, commonly specified at 99.99% or higher. This 4N purity level limits total impurities to roughly 100 parts per million. In demanding optical and semiconductor work, that number alone is not enough. Buyers should request data for metallic contamination, hydroxyl content, bubbles, inclusions, and surface particles.
The material’s softening point is approximately 1,713°C, giving fused silica excellent stability during high-temperature processing. Still, softening point does not mean unlimited operating temperature. Thermal gradients, furnace design, wafer thickness, and heating speed can create warping or stress. Fused silica also expands very little when heated. That is useful, but sudden temperature changes can still damage a poorly finished wafer.
Reliable suppliers should provide lot traceability, dimensional inspection records, surface roughness results, and documented cleaning procedures. Check flatness, edge quality, orientation, and allowable thickness variation before comparing prices. A wafer may look clear under normal light yet contain microscopic defects. I have learned that supplier claims need independent verification, especially for ultra-clean applications. Some specifications remain vague, and that deserves questions. A small pilot order can expose handling marks, inconsistent polishing, or unexpected particles before full production begins.
2026 Best Fused Silica Quartz Wafer Suppliers? - Fused Silica Wafer Basics: 99.99%+ SiO₂ and a 1,713°C Softening Point
| Evaluation Dimension | Typical Fused Silica Wafer Data | Technical Significance | Recommended Verification Item |
|---|---|---|---|
| Primary Material | High-purity fused silica, also called fused quartz | Amorphous silicon dioxide glass produced by melting or flame-fusing silica feedstock rather than crystallizing it. | Confirm the material designation, manufacturing route, and whether the wafer is synthetic or electrically fused. |
| Silicon Dioxide Content | 99.99% SiO₂ or higher; higher-purity grades may reach 99.999% or above. | Low metallic and alkali contamination is important for semiconductor, optical, and high-temperature applications. | Request a lot-specific certificate of analysis showing SiO₂ purity and trace-element concentrations. |
| Softening Point | Approximately 1,713°C | Indicates the temperature at which fused silica begins to deform significantly under a defined test condition. | Check the test method and confirm whether the stated value is a softening point, working point, or deformation temperature. |
| Annealing Point | Approximately 1,210°C to 1,220°C | Near this temperature range, internal stress can relax relatively quickly during controlled thermal processing. | Confirm the annealing schedule and allowable residual-stress level for the intended process. |
| Strain Point | Approximately 1,070°C to 1,120°C | Below the strain point, stress relief becomes substantially slower, which affects thermal forming and cooldown procedures. | Use the supplier's grade-specific value rather than relying only on a generic fused-silica reference. |
| Coefficient of Thermal Expansion | About 0.5 × 10⁻⁶ K−1 near room temperature | Very low thermal expansion provides excellent resistance to thermal shock and dimensional change. | Check the temperature range, measurement direction, and whether the value is an average or instantaneous coefficient. |
| Maximum Continuous Use Temperature | Commonly around 1,000°C to 1,100°C in air, depending on load, atmosphere, geometry, and surface condition. | Fused silica can tolerate higher temperatures, but long-term deformation and contamination risks increase with temperature and mechanical load. | Request application-specific temperature, time, atmosphere, and load limits. |
| Density | Approximately 2.20 g/cm³ at room temperature | Useful for estimating wafer mass, shipping requirements, fixture loading, and process handling behavior. | Confirm the nominal density and dimensional tolerances for mass calculations. |
| Refractive Index | Approximately 1.457 at 589 nm and 20°C | Important for optical windows, photomasks, ultraviolet components, and interference-based measurements. | Specify wavelength, temperature, polarization, and measurement standard when comparing optical data. |
| Ultraviolet Transmission | High transmission is possible into the ultraviolet; the practical cutoff depends on purity, water content, thickness, and surface finish. | Low metallic contamination and controlled hydroxyl content can improve ultraviolet performance. | Request a transmission curve covering the actual operating wavelength and wafer thickness. |
| Electrical Resistivity | Very high electrical resistivity; the exact value varies strongly with temperature, humidity, and impurity level. | Supports electrical isolation in sensor, dielectric, high-voltage, and semiconductor-processing applications. | Require the test temperature, humidity, electrode configuration, and measured resistivity range. |
| Water Absorption | Very low bulk water absorption; surface hydroxyl groups may vary with manufacturing history and cleaning. | Surface chemistry can influence infrared transmission, bonding, coating adhesion, and contamination behavior. | Check hydroxyl content, surface treatment, storage conditions, and cleaning compatibility. |
| Wafer Diameter Options | Common formats include 25 mm, 50 mm, 76.2 mm, 100 mm, 150 mm, and 200 mm; availability is process-dependent. | Diameter selection affects equipment compatibility, handling, edge exclusion, and production yield. | Confirm actual diameter, flat or notch configuration, edge profile, and dimensional drawing. |
| Thickness Range | Available thickness is application-specific, from thin substrates to millimeter-scale plates. | Thickness influences stiffness, optical path length, thermal response, breakage risk, and wafer bow. | Specify nominal thickness, thickness tolerance, total thickness variation, and edge exclusion. |
| Surface Finish | As-cut, lapped, polished, or double-side polished surfaces are commonly available. | Surface roughness and flatness affect optical scatter, lithography, bonding, coating quality, and particle control. | Request surface roughness Ra or RMS, flatness, warp, bow, and polishing specifications. |
| Typical Surface Roughness | Polished surfaces can reach sub-nanometer RMS roughness, while lapped or ground surfaces are significantly rougher. | Lower roughness improves optical quality and can reduce particle retention and interface defects. | Confirm the measurement area, scan size, instrument type, and whether the value is Ra or RMS. |
| Particle and Cleanliness Control | Cleanliness level depends on washing, packaging, handling environment, and customer specification. | Particles and metallic residues can reduce yield in semiconductor and precision optical processes. | Define particle size threshold, allowable particle count, cleaning chemistry, packaging class, and inspection method. |
| Common Applications | Semiconductor processing, optical windows, ultraviolet components, laboratory substrates, sensors, and high-temperature fixtures. | The required purity, surface quality, geometry, and packaging depend on the specific application. | Match the wafer grade to process temperature, wavelength, chemical exposure, dimensional tolerance, and cleanliness needs. |
| Quality Documents | Typical documents include dimensional inspection reports, surface inspection results, certificates of analysis, and traceability records. | Documented lot control helps verify consistency and supports incoming inspection and process qualification. | Require lot number, inspection date, measurement equipment, acceptance criteria, and retained sample policy. |
Note: Values shown are typical reference data for fused silica and may vary by grade, manufacturing route, geometry, surface condition, measurement method, and application-specific specification.
FAQS
It is made from high-purity, amorphous silicon dioxide. Purity commonly reaches 99.99% or higher. That equals roughly 100 parts per million of total impurities. Purity alone is not enough.
It indicates strong stability during high-temperature processing. It does not mean unlimited operating temperature. Thermal gradients, rapid heating, and thin sections can cause stress or warping. Heating control matters.
Request metallic contamination, hydroxyl content, bubbles, inclusions, and surface particles. Also check flatness, edge quality, orientation, and thickness variation. A clear wafer can still contain microscopic defects.
Standard wafers commonly require three to eight weeks. Custom thickness or double-side polishing may exceed twelve weeks. Confirm whether inspection and packaging are included. A low quote may hide a longer queue.
Orders may begin around 10 to 25 pieces. Smaller research orders may be possible at higher unit prices. Public information is often incomplete. A small paid pilot gives better evidence.
Request drawings showing diameter, thickness tolerance, chamfer size, flatness, bow, warp, and marking. Review measurement records and repeatability. Sample appearance is not enough.
Check wavelength-specific transmission, absorption, flatness maps, and polishing results. Performance at 365 nanometers may not suit deeper ultraviolet systems. Optical clarity alone can mislead.
Review thickness tolerance, total thickness variation, particle limits, edge geometry, and lot consistency. Request traceable inspection records and material certificates. Small differences can reduce production yield.
Check thermal shock resistance, dimensional stability, and contamination control. Consider furnace design, wafer thickness, and heating speed. I might overvalue appearance sometimes. That is a costly mistake.
Packaging damage can create marks or particles before delivery. Ask for documented cleaning procedures and rejected-lot handling. Check cleaning compatibility, not only optical clarity. Practical testing reveals uncomfortable surprises.
Conclusion
Choosing the right Fused Silica Quartz Wafer supplier in 2026 requires more than comparing price alone. High-quality wafers typically provide 99.99% or higher SiO₂ purity, excellent thermal stability, and a softening point near 1,713°C. Buyers should evaluate available diameters from 100 to 300 mm, along with total thickness variation, bow, warp, surface finish, and hydroxyl (OH) levels. These specifications directly affect process consistency, optical performance, and reliability in demanding environments.
A thorough supplier review should include ISO 9001 certification, compliance with relevant SEMI standards, coating capabilities, inspection methods, and complete material traceability. Comparing purity, lead time, minimum order quantity, customization options, and production capacity can help match supply to project requirements. UV optics may prioritize low absorption and precise surface quality, while semiconductor, MEMS, and high-temperature tooling applications may require tighter geometry, specialized coatings, or enhanced thermal performance. The best choice is the supplier that consistently aligns technical quality, documentation, delivery, and application-specific support.